Assembly using Velvet
Keywords: de novo assembly, Velvet, Galaxy, Microbial Genomics Virtual Lab
Background
Velvet is one of a number of de novo assemblers that use short read sets as input (e.g. Illumina Reads), and the assembly method is based on de Bruijn graphs. For information about Velvet see this link.
In this activity, we will perform a de novo assembly of a short read set using the Velvet assembler.
Learning objectives
At the end of this tutorial you should be able to:
- assemble the reads using Velvet, and
- examine the output assembly.
Import and view data
If you have completed the previous tutorial on Quality Control, you should already have the required files in your current Galaxy history. If not, see how to get them here.
The data
The read set for today is from an imaginary Staphylococcus aureus bacterium with a miniature genome. The whole genome shotgun method used to sequence our mutant strain read set was produced on an Illumina DNA sequencing instrument.
- The files we need for assembly are the
mutant_R1.fastq andmutant_R2.fastq . -
(We don’t need the reference genome sequences for this tutorial).
-
The reads are paired-end.
-
Each read is 150 bases long.
-
The number of bases sequenced is equivalent to 19x the genome sequence of the wildtype strain. (Read coverage 19x - rather low!).
- Click on the View Data button (the
 ) next to one of the FASTQ sequence files.
Assemble reads with Velvet
- We will perform a de novo assembly of the mutant FASTQ reads into long contiguous sequences (in FASTA format.)
- Velvet requires the user to input a value of k for the assembly process. K-mers are fragments of sequence reads. Small k-mers will give greater connectivity, but large k-mers will give better specificity.
- Go to
Tools → NGS Analysis → NGS: Assembly → velvet -
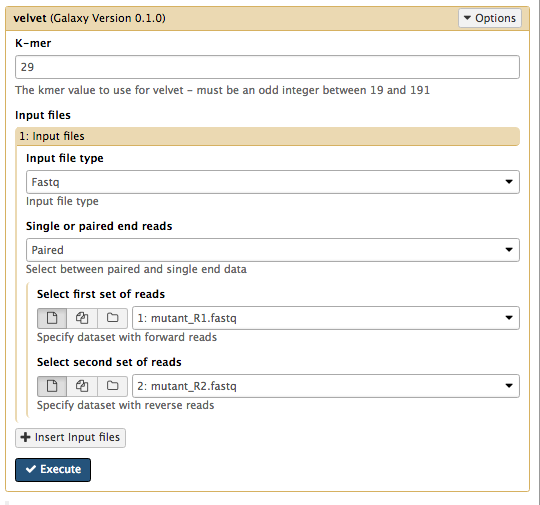
Set the following parameters (leave other settings as they are):
K-mer : Enter the value for k that you have been assigned in the spreadsheet.
Input file type : FastqSingle or paired end reads : PairedSelect first set of reads :mutant_R1.fastq Select second set of reads :mutant_R2.fastq
-
Your tool interface should look like this (you will most likely have a different value for k):
- Click
Execute
Examine the output
- Galaxy is now running velvet on the reads for you.
- Press the refresh button in the history pane to see if it has finished.
-
When it is finished, you will have four new files in your history.
- a
Contigs file - a
Contigs stats file - the velvet
log file - an assembly
Last Graph file
- a
-
Click on the View Data button
on each of the files. -
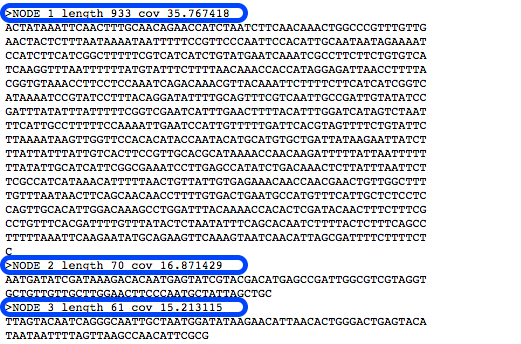
The
Contigs file will show each contig with the k-mer length and k-mer coverage listed as part of the header (however, these are just called length and coverage).- K-mer length: For the value of k chosen in the assembly, a measure of how many k-mers overlap (by 1 bp each overlap) to give this length.
- K-mer coverage: For the value of k chosen in the assembly, a measure of how many k-mers overlap each base position (in the assembly).
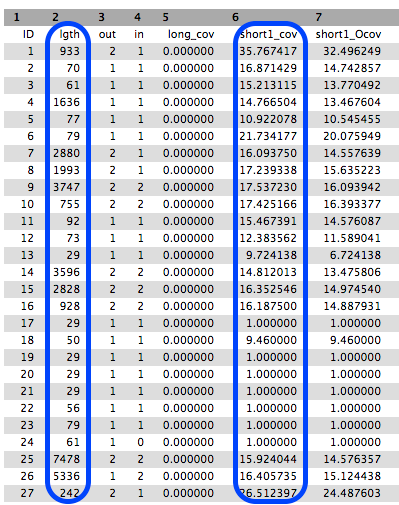
- The
Contigs stats file will show a list of these k-mer lengths and k-mer coverages.
- We will summarise the information in the
log file. - Go to
NGS Common Toolsets → FASTA manipulation → Fasta statistics - For the required input file, choose the velvet
Contigs file. - Click
Execute . - A new file will appear called
Fasta summary stats - Click the eye icon to look at this file.
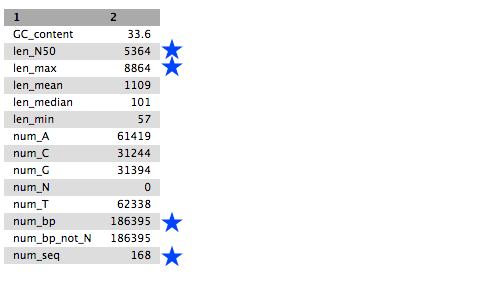
- Look at:
- num_seq: the number of contigs in the FASTA file.
- num_bp: the number of assembled bases. Roughly proportional to genome size.
- len_max: the biggest contig.
- len_N50: N50 is a contig size. If contigs were ordered from small to large, half of all the nucleotides will be in contigs this size or larger.
Now copy the relevant data back into the k-mer spreadsheet on your line.
Along with the demonstrator, have a look at the effect of the k-mer size on the output metrics of the assembly. Note that there are local maxima and minima in the charts.
Assembly with Velvet Optimiser
Now that we have seen the effect of k-mer size on the assembly, we will run the Velvet Optimiser to automatically choose the best k-mer size for us. It will use the “n50” to determine the best k-mer value to use. It then performs the further graph cleaning steps and automatically chooses other parameters for velvet. We should get a much better assembly result than we did with our attempts with Velvet alone.
- Go to
Tools → NGS Analysis → NGS: Assembly → Velvet Optimiser -
Set the following parameters (leave other settings as they are):
Start k-mer size : 45End k-mer size : 73Input file type : FastqSingle or paired end reads : PairedSelect first set of reads :mutant_R1.fastq -
Select second set of reads :mutant_R2.fastq -
Click
Execute
-
Use the Fasta Statistics tool you used earlier to summarise the Velvet Optimiser